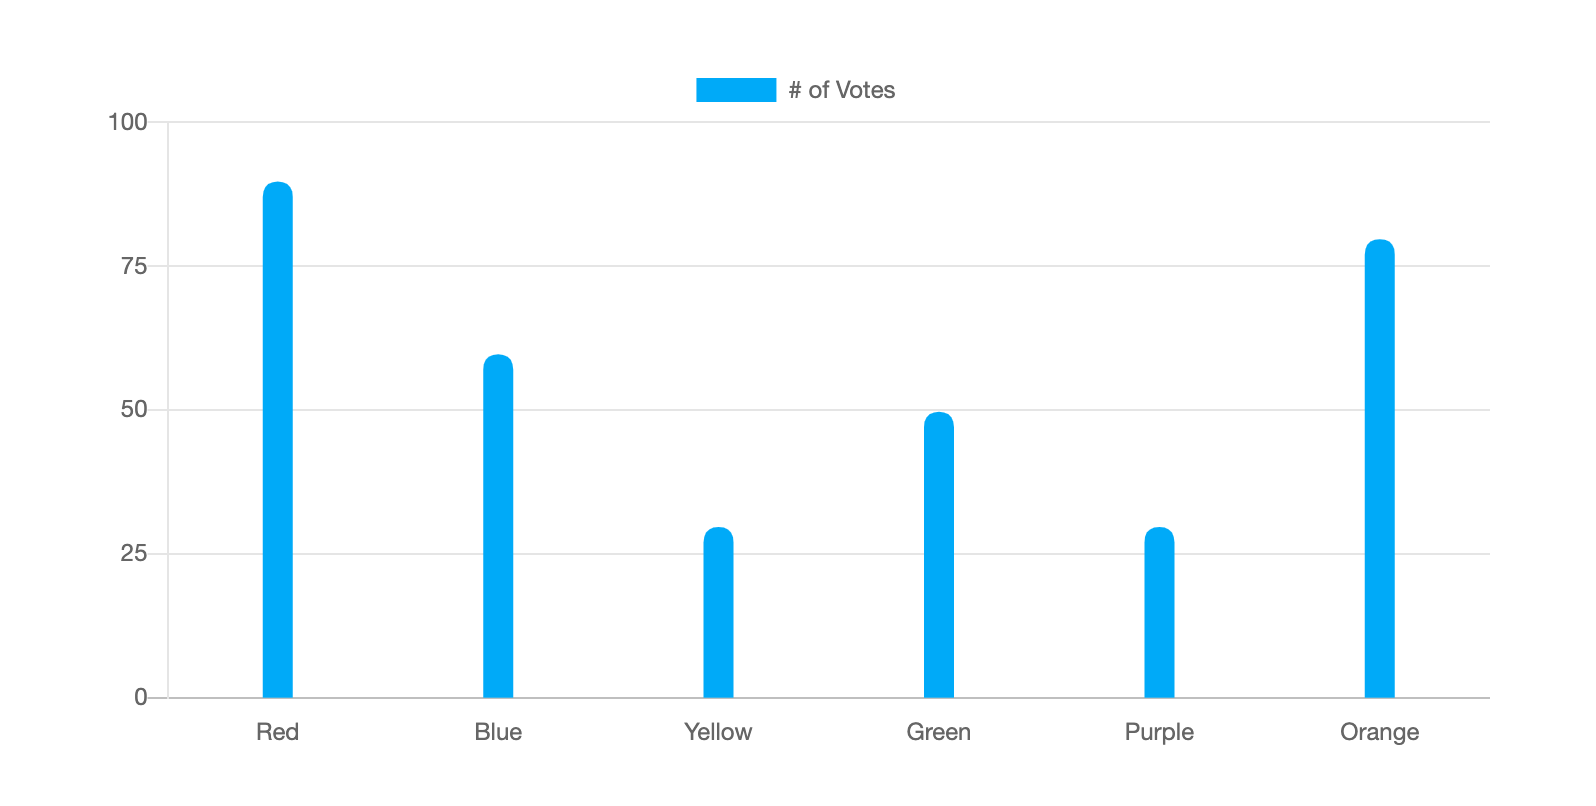
If you are using Chart.js in your project to visualise your data and there is a requirement of plotting bar chart which has circular shape on top corners only then you can read this post to understand how you can achieve that.
Chart.js provides draw function which can be used to change the shape of default charts and we are using this function to make the shape of bar chart circular on top. We are modifying this by using Chart.elements.Rectangle.prototype.draw.
The installation and code which is required to plot top only circular shape bar chart is as below
You can add Chart.js library by pasting below code on your HTML page
<script src="https://cdnjs.cloudflare.com/ajax/libs/Chart.js/2.9.3/Chart.min.js"></script>
You can paste below HTML code on your webpage.
<div>
    <canvas id="myChart"></canvas>
</div>The javascript code which will be used to do the task is as follow
var radiusPlus = 4;
Chart.elements.Rectangle.prototype.draw = function() {
   var ctx = this._chart.ctx;
   var vm = this._view;
   var left, right, top, bottom, signX, signY, borderSkipped;
   var borderWidth = vm.borderWidth;

   if (!vm.horizontal) {
       left = vm.x - vm.width / 2;
       right = vm.x + vm.width / 2;
       top = vm.y;
       bottom = vm.base;
       signX = 1;
       signY = bottom > top? 1: -1;
       borderSkipped = vm.borderSkipped || 'bottom';
   } else {
       left = vm.base;
       right = vm.x;
       top = vm.y - vm.height / 2;
       bottom = vm.y + vm.height / 2;
       signX = right > left? 1: -1;
       signY = 1;
       borderSkipped = vm.borderSkipped || 'left';
   }

   if (borderWidth) {
   var barSize = Math.min(Math.abs(left - right), Math.abs(top - bottom));
   borderWidth = borderWidth > barSize? barSize: borderWidth;
   var halfStroke = borderWidth / 2;
   var borderLeft = left + (borderSkipped !== 'left'? halfStroke * signX: 0);
   var borderRight = right + (borderSkipped !== 'right'? -halfStroke * signX: 0);
   var borderTop = top + (borderSkipped !== 'top'? halfStroke * signY: 0);
   var borderBottom = bottom + (borderSkipped !== 'bottom'? -halfStroke * signY: 0);

   if (borderLeft !== borderRight) {
       top = borderTop;
       bottom = borderBottom;
   }
   if (borderTop !== borderBottom) {
       left = borderLeft;
       right = borderRight;
   }
   }

   var barWidth = Math.abs(left - right);
   var roundness = this._chart.config.options.barRoundness || 0.5;
   var radius = barWidth * roundness * 0.5;

   var prevTop = top;

   top = prevTop + radius;
   var barRadius = top - prevTop;

   ctx.beginPath();
   ctx.fillStyle = vm.backgroundColor;
   ctx.strokeStyle = vm.borderColor;
   ctx.lineWidth = borderWidth;

   // draw the chart
   var x= left, y = (top - barRadius + 1), width = barWidth, height = bottom - prevTop, radius = barRadius + radiusPlus;

   ctx.moveTo(x + radius, y);
   ctx.lineTo(x + width - radius, y);
   ctx.quadraticCurveTo(x + width, y, x + width, y + radius);
   ctx.lineTo(x + width, y + height);
   ctx.lineTo(x, y + height);
   ctx.lineTo(x, y + radius);
   ctx.quadraticCurveTo(x, y, x + radius, y);
   ctx.closePath();

   ctx.fill();
   if (borderWidth) {
   ctx.stroke();
   }

   top = prevTop;
}

var ctx = document.getElementById("myChart").getContext("2d");
var myChart = new Chart(ctx, {
   type: 'bar',
   data: {
   labels: ['Red', 'Blue', 'Yellow', 'Green', 'Purple', 'Orange'],
   datasets: [{
           label: '# of Votes',
           data: [90, 60, 30, 50, 30, 80],
           borderWidth: 0,
           backgroundColor: "#00AAFB",
   }]
   },
   options: {
   scales: {
       xAxes: [{
           barThickness: 15,
           gridLines: {
               offsetGridLines: false,
               display: false
           }
       }],
       yAxes: [{
           ticks: {
               beginAtZero: true,
               stepSize: 25,
               suggestedMin: 50,
               suggestedMax: 100
           }
       }]
   }
   }
});
The variable 'radiusPlus' is used to change radius value.
Here we are using Chart.js library with a version - 2.9.3 and we have tested the code using that version.
0 Comments