Assign different colors to each bar of a bar chart in Chart.js
A bar chart is a graphical representation of data that uses bars to represent different values. Bar charts are a popular way to visualize data, and Chart.js is a JavaScript library that makes it easy to create bar charts in web browsers. One common way to customize bar charts is to assign different colors to each bar. This can help to highlight different data values or to group related data values together. In Chart.js, there are a few different ways to accomplish this.
const ctx = document.getElementById('chart_id').getContext('2d');
const myChart = new Chart(ctx, {
type: 'bar',
data: {
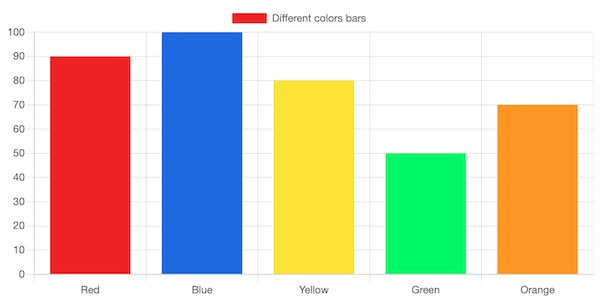
labels: ['Red', 'Blue', 'Yellow', 'Green', 'Orange'],
datasets: [{
label: 'Different colors bars',
data: [90, 100, 80, 50, 70],
backgroundColor: ["#ed1e1e", "#2269e5", "#fce302", "#04f759", "#fc9700"]
}]
}
});Output
1. The code defines a constant variable "ctx" and assigns the value of the element with id "chart_id" and its 2d context.
2. The code defines a constant variable "myChart" and assigns the value of a new Chart, using the "ctx" variable and setting the type to "bar".
3. The code sets the "data" property of the "myChart" variable to an object. This object has a "labels" property set to an array of strings, and a "datasets" property set to an array with one object.
4. This object has a "label" property set to a string, a "data" property set to an array of numbers, and a "backgroundColor" property set to an array of hexadecimal color codes.
5. The code then calls the "render" method on the "myChart" variable, which causes the chart to be displayed on the page.
Assign random colors to bars by creating a random color generator function
We'll be creating a function that generates random colors. This can be useful for assigning random colors to bars in a graph, for example. The function will take no arguments and will return a string representing a hexadecimal color code.
function getRandomColor() {
    var letters = '0123456789ABCDEF'.split('');
    var color = '#';
    for (var i = 0; i < 6; i++ ) {
        color += letters[Math.floor(Math.random() * 16)];
    }
    return color;
}

var data_arr = [90, 40, 80, 50, 70];
var bg_colors = data_arr.map( item => getRandomColor() );

const ctx = document.getElementById('chart_id').getContext('2d');
const myChart = new Chart(ctx, {
    type: 'bar',
    data: {
        labels: ['Red', 'Blue', 'Yellow', 'Green', 'Orange'],
        datasets: [{
            label: 'Different colors bars',
            data: data_arr,
            backgroundColor: bg_colors
        }]
    },
    options: {
        scales: {
            y: {
                beginAtZero: true
            }
        }
    }
});Explanation of the above code example
The first thing this code does is define a function, getRandomColor(). This function will be used to generate a random color for each bar in the chart.
Next, an array named data_arr is created. This array will be used to hold the data that will be represented in the chart.
Then, a new array named bg_colors is created. This array will hold the background color for each bar in the chart. The data in the data_arr array is looped through, and for each item in the array, the getRandomColor function is called and the return value is added to the bg_colors array.
Finally, the chart is created. A new Chart object is created, and the type of chart is specified as a bar chart. The data for the chart is specified next. There are two data arrays, one for the labels and one for the data. The backgroundColor property is set to the bg_colors array.
Some options for the chart are also specified. The y scale is set to begin at zero. This ensures that the bars will start at the bottom of the chart.
- Assign fixed width to the columns of bar chart in Chart.js
- Bar chart with circular shape from corner in Chart.js
- Create bar chart in Chart.js
- Assign a fixed height to chart in Chart.js
- Assign min and max values to y-axis in Chart.js
- allows keeping the URL while rendering a different page
- Assign default values to function parameters in Javascript