Bar chart with circular shape from corner in Chart.js
In this post, we are going to show to make bar chart with the circular shape from corners using a different version of Chart.js
// If you are using Chart.js version - 3.0.0 and above
var ctx = document.getElementById('my_chart').getContext('2d');
var myChart = new Chart(ctx, {
type: 'bar',
data: {
labels: ['Jan', 'Feb', 'Mar', 'Apr', 'May', 'Jun'],
datasets: [{
label: 'Months',
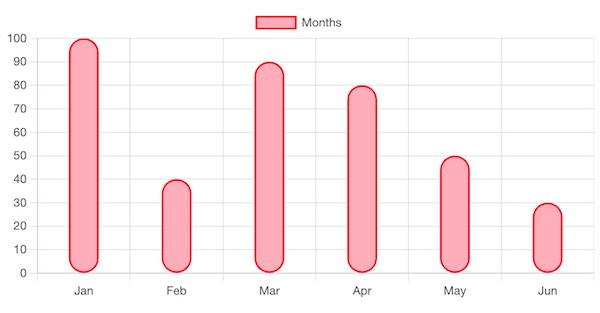
data: [100, 40, 90, 80, 50, 30],
backgroundColor: '#ffadb9',
borderColor: '#f7072b',
barThickness: 30,
borderWidth: 2,
borderRadius: 20, // This will round the corners
borderSkipped: false, // To make all side rounded
}]
},
options: {
scales: {
y: {
beginAtZero: true
}
}
}
});If you are using Chat.js version 3.x.x or above, you can use the above code to make the circular corners. We are using the borderRadius property in datasets objects along with borderSkipped to make all sides of the bar circular.
borderRadius in Chart.js
We use the borderRadius property and assign a numeric value to it to make the rounded corners bars when plotting the chart. You need to assign this property in datasets objects.
datasets: [
    {
        label: 'Months',
        data: [100, 40, 90, 80, 50, 30],
        borderRadius: 20
    },
    {
        label: 'Year',
        data: [100, 40, 90, 80, 50, 30],
        borderRadius: 10
    }
]
Top only circular bars
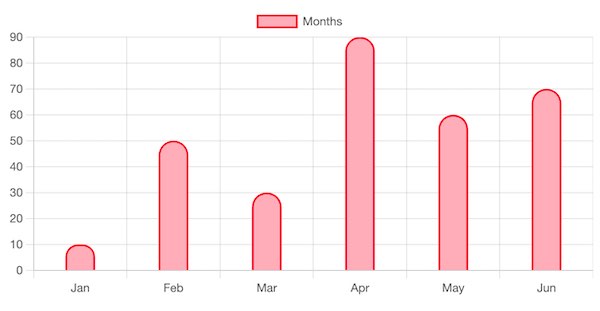
If you want to make the bar columns circular from the top only, you can set borderSkipped property to true.
Code Example
var ctx = document.getElementById('my_chart').getContext('2d');
var myChart = new Chart(ctx, {
    type: 'bar',
    data: {
        labels: ['Jan', 'Feb', 'Mar', 'Apr', 'May', 'Jun'],
        datasets: [{
            label: 'Months',
            data: [10, 50, 30, 90, 60, 70],
            backgroundColor: '#ffadb9',
            borderColor: '#f7072b',
            borderWidth: 2,
            barThickness: 30,
            borderRadius: 20
        }]
    },
    options: {
        scales: {
            y: {
                beginAtZero: true
            }
        }
    }
});
Output
Live Demo for top only circular bars
Chart.js v2.x.x - Make bars circular from corners
If you are using the chart.js version 2.x.x then you can use the below code to make rounded corners.
Chart.elements.Rectangle.prototype.draw = function() {
    var ctx = this._chart.ctx;
    var vm = this._view;
    var left, right, top, bottom, signX, signY, borderSkipped, radius;
    var borderWidth = vm.borderWidth;
    var cornerRadius = 20;

    if (!vm.horizontal) {
        left = vm.x - vm.width / 2;
        right = vm.x + vm.width / 2;
        top = vm.y;
        bottom = vm.base;
        signX = 1;
        signY = bottom > top? 1: -1;
        borderSkipped = vm.borderSkipped || 'bottom';
    } else {
        left = vm.base;
        right = vm.x;
        top = vm.y - vm.height / 2;
        bottom = vm.y + vm.height / 2;
        signX = right > left? 1: -1;
        signY = 1;
        borderSkipped = vm.borderSkipped || 'left';
    }

    if (borderWidth) {
        var barSize = Math.min(Math.abs(left - right), Math.abs(top - bottom));
        borderWidth = borderWidth > barSize? barSize: borderWidth;
        var halfStroke = borderWidth / 2;
        var borderLeft = left + (borderSkipped !== 'left'? halfStroke * signX: 0);
        var borderRight = right + (borderSkipped !== 'right'? -halfStroke * signX: 0);
        var borderTop = top + (borderSkipped !== 'top'? halfStroke * signY: 0);
        var borderBottom = bottom + (borderSkipped !== 'bottom'? -halfStroke * signY: 0);
        if (borderLeft !== borderRight) {
            top = borderTop;
            bottom = borderBottom;
        }
        if (borderTop !== borderBottom) {
            left = borderLeft;
            right = borderRight;
        }
    }

    ctx.beginPath();
    ctx.fillStyle = vm.backgroundColor;
    ctx.strokeStyle = vm.borderColor;
    ctx.lineWidth = borderWidth;
    var corners = [
        [left, bottom],
        [left, top],
        [right, top],
        [right, bottom]
    ];

    var borders = ['bottom', 'left', 'top', 'right'];
    var startCorner = borders.indexOf(borderSkipped, 0);
    if (startCorner === -1) {
        startCorner = 0;
    }

    function cornerAt(index) {
        return corners[(startCorner + index) % 4];
    }

    var corner = cornerAt(0);
    ctx.moveTo(corner[0], corner[1]);

    for (var i = 1; i < 4; i++) {
        corner = cornerAt(i);
        nextCornerId = i+1;
        if(nextCornerId == 4){
            nextCornerId = 0
        }

        nextCorner = cornerAt(nextCornerId);

        width = corners[2][0] - corners[1][0];
        height = corners[0][1] - corners[1][1];
        x = corners[1][0];
        y = corners[1][1];

        var radius = cornerRadius;

        if(radius > height/2){
            radius = height/2;
        }if(radius > width/2){
            radius = width/2;
        }

        ctx.moveTo(x + radius, y);
        ctx.lineTo(x + width - radius, y);
        ctx.quadraticCurveTo(x + width, y, x + width, y + radius);
        ctx.lineTo(x + width, y + height - radius);
        ctx.quadraticCurveTo(x + width, y + height, x + width - radius, y + height);
        ctx.lineTo(x + radius, y + height);
        ctx.quadraticCurveTo(x, y + height, x, y + height - radius);
        ctx.lineTo(x, y + radius);
        ctx.quadraticCurveTo(x, y, x + radius, y);
    }

    ctx.fill();
    if (borderWidth) {
        ctx.stroke();
    }
};

//NOW DRAW YOUR CHART
var ctx = document.getElementById('myChart').getContext('2d');
var myChart = new Chart(ctx, {
    type: 'bar',
    data: {
       labels: ['Red', 'Blue', 'Yellow', 'Green', 'Purple', 'Orange'],
       datasets: [{
            label: '# of Votes',
            data: [90, 60, 30, 50, 30, 80],
            borderWidth: 0,
            backgroundColor: "#00AAFB",
       }]
    },
    options: {
       scales: {
            xAxes: [{
               barThickness: 15,
            }],
            yAxes: [{
               ticks: {
                  beginAtZero: true
               }
            }]
       }
    }
});