javascript
How to customize a title in chart.js
Charts are a great way to visualize data, and chart.js is a powerful library for creating them. However, sometimes you may want to customize the title of your chart. This tutorial will show you how to do that.
const ctx = document.getElementById('myChart').getContext('2d');
const myChart = new Chart(ctx, {
  type: 'bar',
  data: {
    labels: ['Jan', 'Feb', 'Mar', 'Apr'],
    datasets: [{
      label: 'Months',
      data: [50, 30, 90, 70]
    }]
  },
  options: {
        plugins: {
            title: {
                display: true,
                text: 'Title goes here ...',
                color: '#0055ff',
                position: 'bottom',
                fullSize: true,
                padding: 30,
                align: 'start',
                font: {
                	family: 'Arial',
                	size: 30,
                    weight: 'bold',
                    style: 'italic',
                    lineHeight: 2.0
                }
            }
        }
    }
});
Live Demo - on jsfiddle
Output
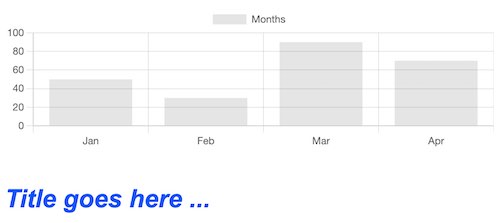
The code example above is using the Chart.js library to create a bar chart with plugin options for the title. The title plugin options include specifying the text, color, position, padding, alignment, and font family, font size, font weight, and font style.
Was this helpful?
Similar Posts