Print DataFrame in pretty format in Terminal
A DataFrame is a two-dimensional data structure, i.e., data is aligned in a tabular fashion in rows and columns. Each column can hold a different type of data. You can use the tabular package or IPython.display() function to print tabular data in a pretty format. The following code shows how to print a DataFrame in a pretty format in the Terminal.
Solution 1: Print DataFrame in pretty format using tabulate package
If you're working with data in Python, you'll inevitably come across the powerful pandas library. pandas is a versatile library that allows you to work with data in a number of different ways. In this article, we'll take a look at how to use the tabulate package to print your data in a pretty format.
Install tabulate package using the below command
pip install tabulateCode example - print DataFrame in grid format
import pandas as pd
from tabulate import tabulate

# create a dataframe
df = pd.DataFrame({
    'subject': ['Physics', 'Chemistry', 'English', 'Arts', 'Math', 'Ecomomics'],
    'score': [90, 89, 93, 76, 82, 87],
    'department': ['science', 'science', 'literature', 'arts', 'science', 'commerce']
})

print(tabulate(df, headers='keys', tablefmt='fancy_grid'))
Output
╒════╤═══════════╤═════════╤══════════════╕
│    │ subject   │   score │ department   │
╞════╪═══════════╪═════════╪══════════════╡
│  0 │ Physics   │      90 │ science      │
├────┼───────────┼─────────┼──────────────┤
│  1 │ Chemistry │      89 │ science      │
├────┼───────────┼─────────┼──────────────┤
│  2 │ English   │      93 │ literature   │
├────┼───────────┼─────────┼──────────────┤
│  3 │ Arts      │      76 │ arts         │
├────┼───────────┼─────────┼──────────────┤
│  4 │ Math      │      82 │ science      │
├────┼───────────┼─────────┼──────────────┤
│  5 │ Ecomomics │      87 │ commerce     │
╘════╧═══════════╧═════════╧══════════════╛
The above code print the DataFrame df in grid format inside the terminal.
Code example - Print DataFrame in SQL table format
print(tabulate(df, headers='keys', tablefmt='psql'))Output
+----+-----------+---------+--------------+
|    | subject   |   score | department   |
|----+-----------+---------+--------------|
|  0 | Physics   |      90 | science      |
|  1 | Chemistry |      89 | science      |
|  2 | English   |      93 | literature   |
|  3 | Arts      |      76 | arts         |
|  4 | Math      |      82 | science      |
|  5 | Ecomomics |      87 | commerce     |
+----+-----------+---------+--------------+
Solution 2: Print DataFrame in Table format using IPython package
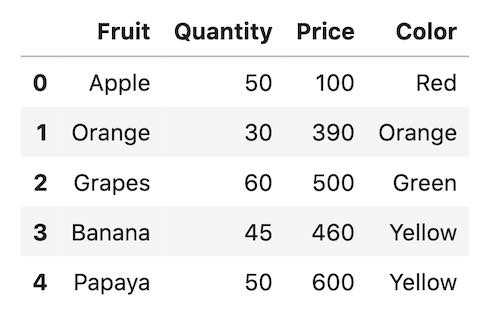
Printing a DataFrame in table format using the IPython package is a simple process that can be completed in just a few steps. First, you need to import the IPython package into your Python environment. Second, you need to create a DataFrame object. Finally, you can print the DataFrame in table format using the IPython.display.display() function.
We are using IPython in Jupyter to print a DataFrame in table format.
# import Ipython and pandas packages
from IPython.display import display
import pandas as pd

# creating a DataFrame
df = pd.DataFrame({'Fruit' : ['Apple', 'Orange', 'Grapes', 'Banana', 'Papaya'],
        'Quantity' : [50, 30, 60, 45, 50],
        'Price' : [100, 390, 500, 460, 600],
        'Color': ['Red', 'Orange', 'Green', 'Yellow', 'Yellow']})

# displat the DataFrame in table format
display(df)
Output